Project Level Reports and Dashboard
Salesforce reports and dashboards are the analytical components of the application data. They are used to convert business requirements into visual representations such as graphs, pie charts, tables, scatter charts, gauges, metrics, funnel charts, and so on.
Individual Project Level Report
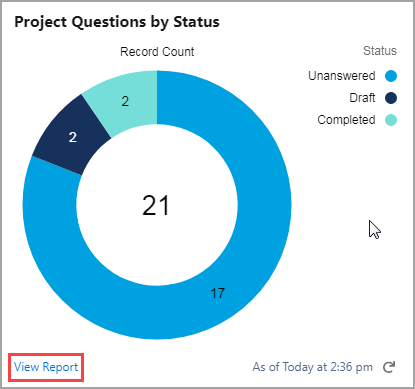
LFS includes one out-of-the-box report, Project Questions by Status, that allows you to quickly view a graphical representation of your project data and analyze the Record Count vs Status information of your project questions.
Navigate to the report lightning component on the project details page as shown below. Click the View Report link to view all the questions of the project organized by status.
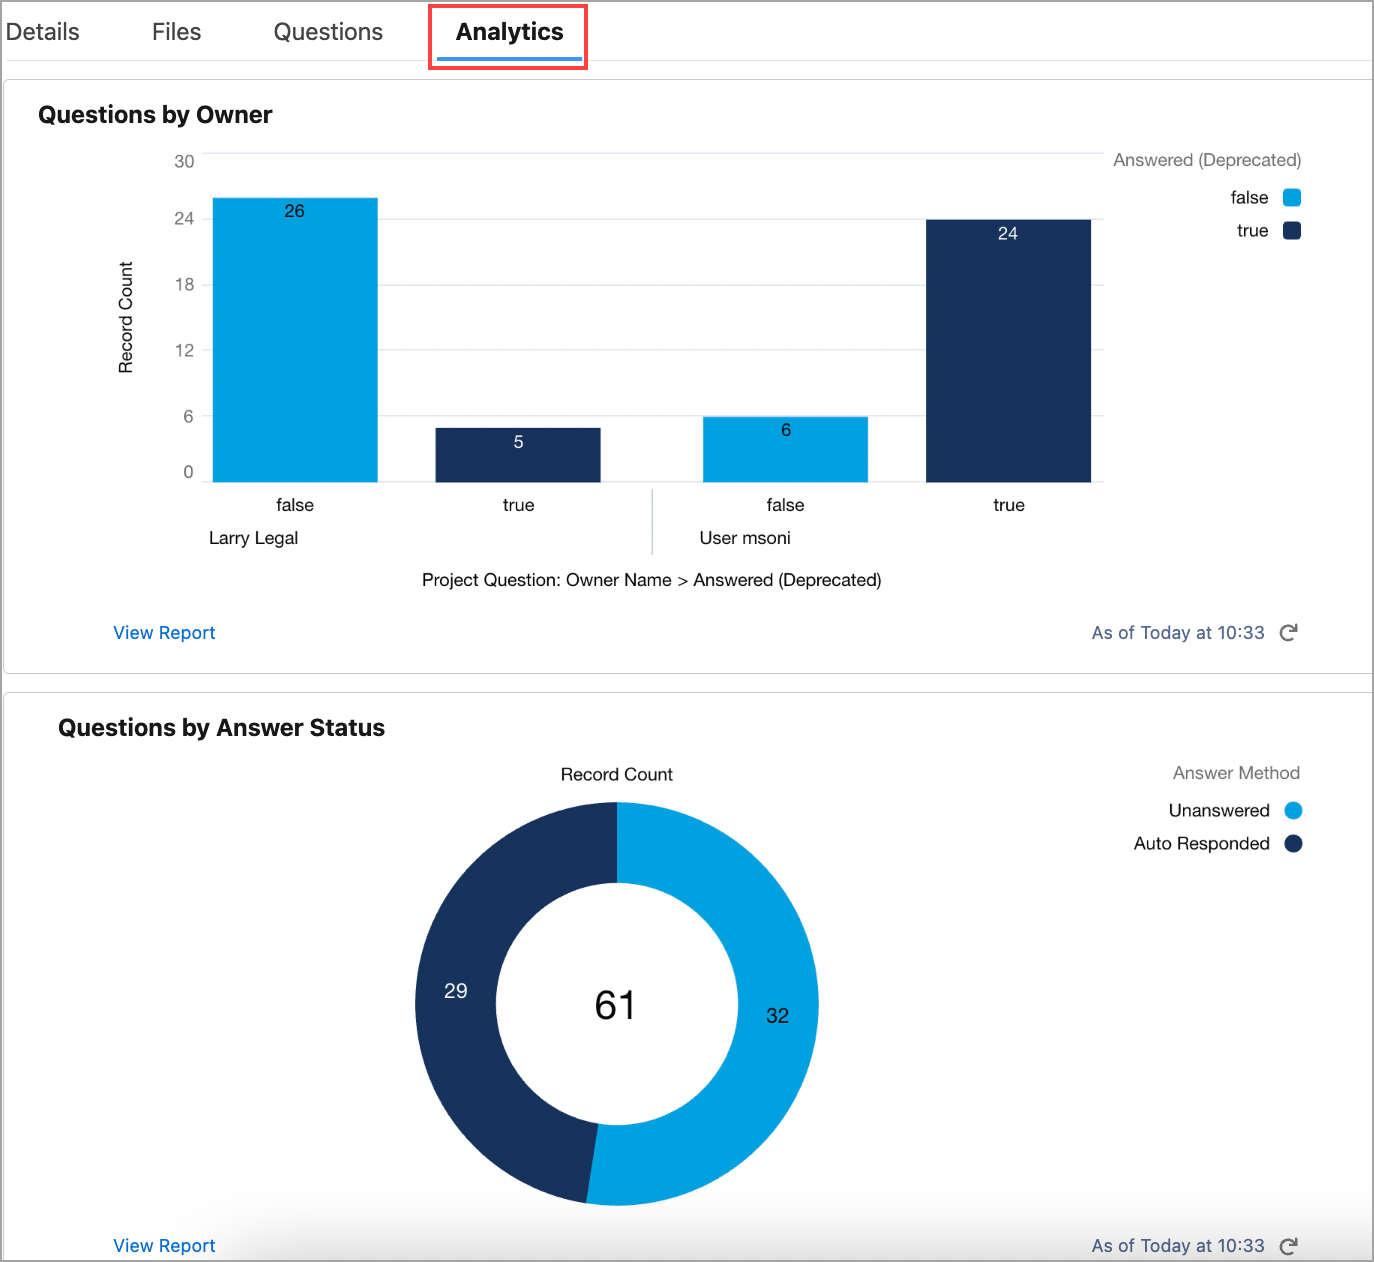
As part of onboarding, you can also get the following pre-built reports under the Analytics tab. To configure the Analytics tab on the Project Record page, contact your Loopio Support Representative.
Questions by Owner
Questions by Answer Status
Project Questions by Status
Overall Project Level Dashboard and Reports
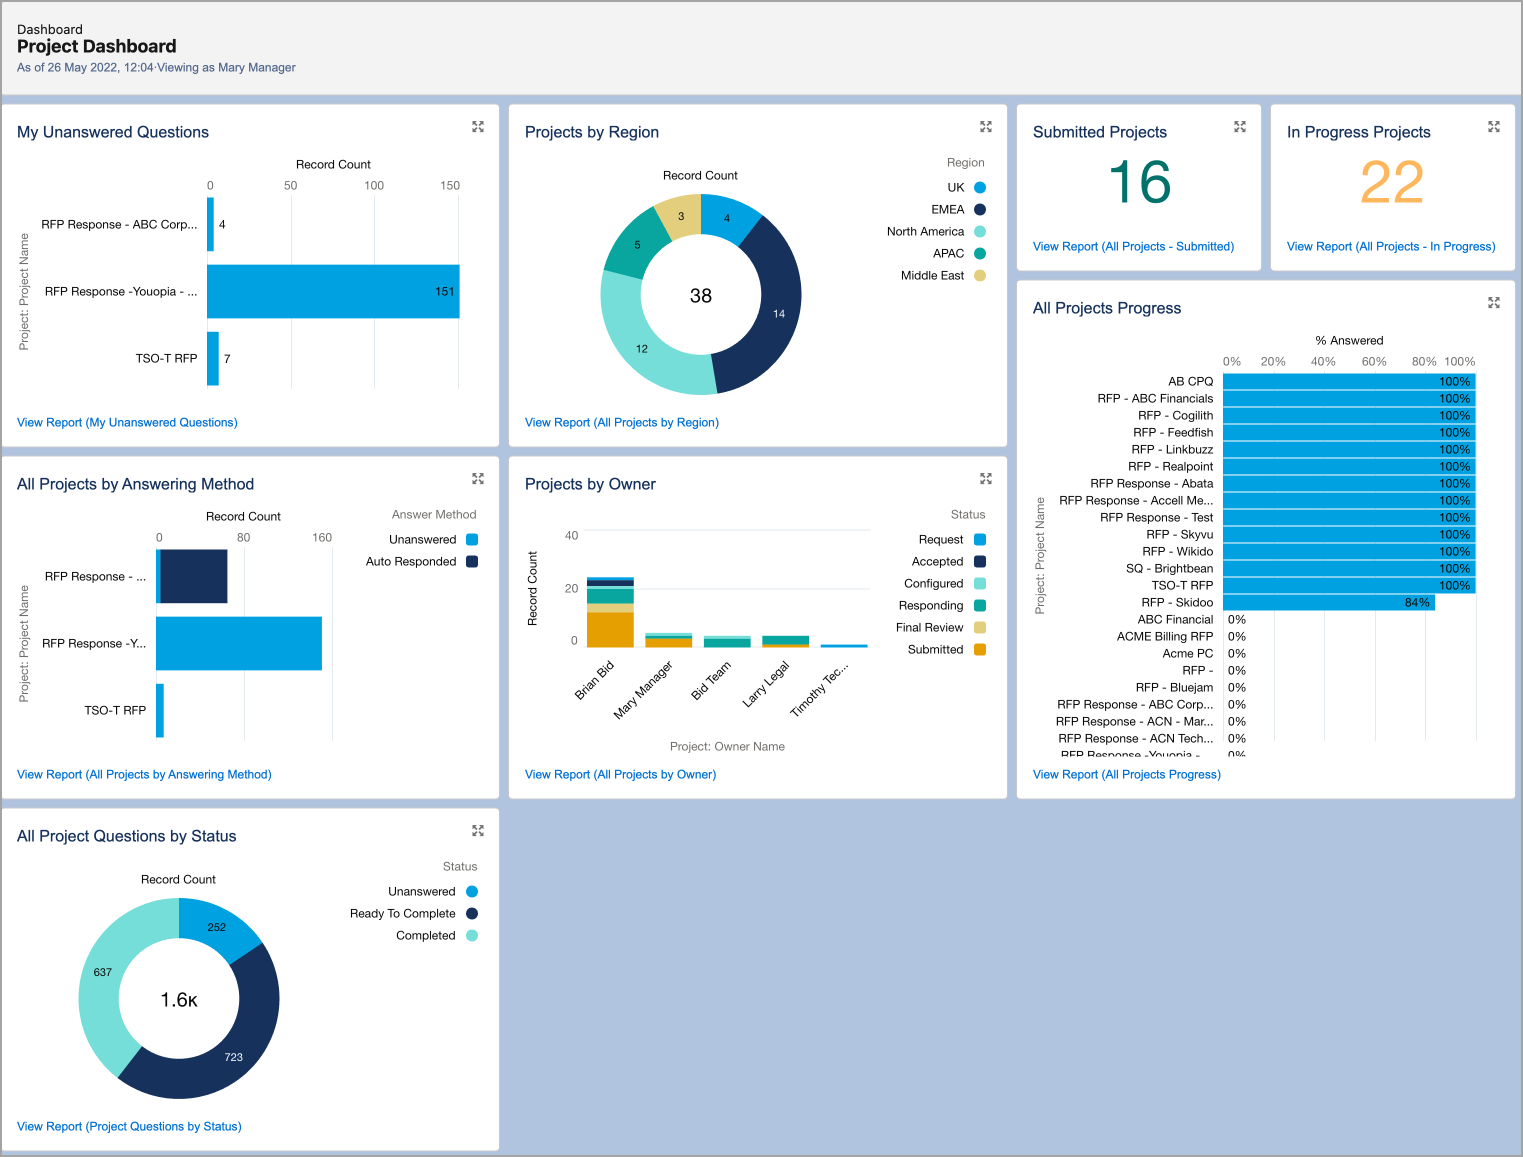
LFS also includes a Dashboard and some pre-built reports that allow you to quickly view a graphical representation of all project data
Navigate to the Dashboard tab to review overall project level reports. Click the View Report link to view the particular report in detail.
You can also create your own reports and dashboards based on your company's requirements. For more information, see Reports & Dashboards for Lightning Experience.